The all-new Analytics module, which is part of the new Appspace 8.0 release, will provide console-based statistics for content, channels, enterprise messaging apps, users, devices, and the Employee App portal, ideal for use in planning your own content and device strategies.
Widgets on the Analytics dashboard will display trends and data of the content usage and type, channel type and publishing statistics, enterprise messaging app statistics, and user and device activity details. Users will also have the option to click on each widget to view other statistics in detail, and filter data according to any selected time period. Depending on the widget, the data can be filtered using the following criteria.
- By Account
- By Date Range (Today/Last 7, 30 or 90 days/Last 12 or 24 months/Current or previous year).
- By Channel
- By Content
These analytics will also be available in the Channels module for each individual channel, and in any content editor window, displaying analytics for the selected channel or content, respectively.
In this first phase, users will only be able to view analytics data via these widgets.
A new Reports (Limited Release) feature has been introduced in the Appspace 8.1-ac.30 release, allowing organizations to view and export available metrics needed to make data driven decisions in order to optimize customer facilities, or the Appspace service itself to ultimately better serve the needs of the customers.
This article provides illustrations on navigating the Analytics dashboard and its widgets.
User Interface and Navigation
Analytics
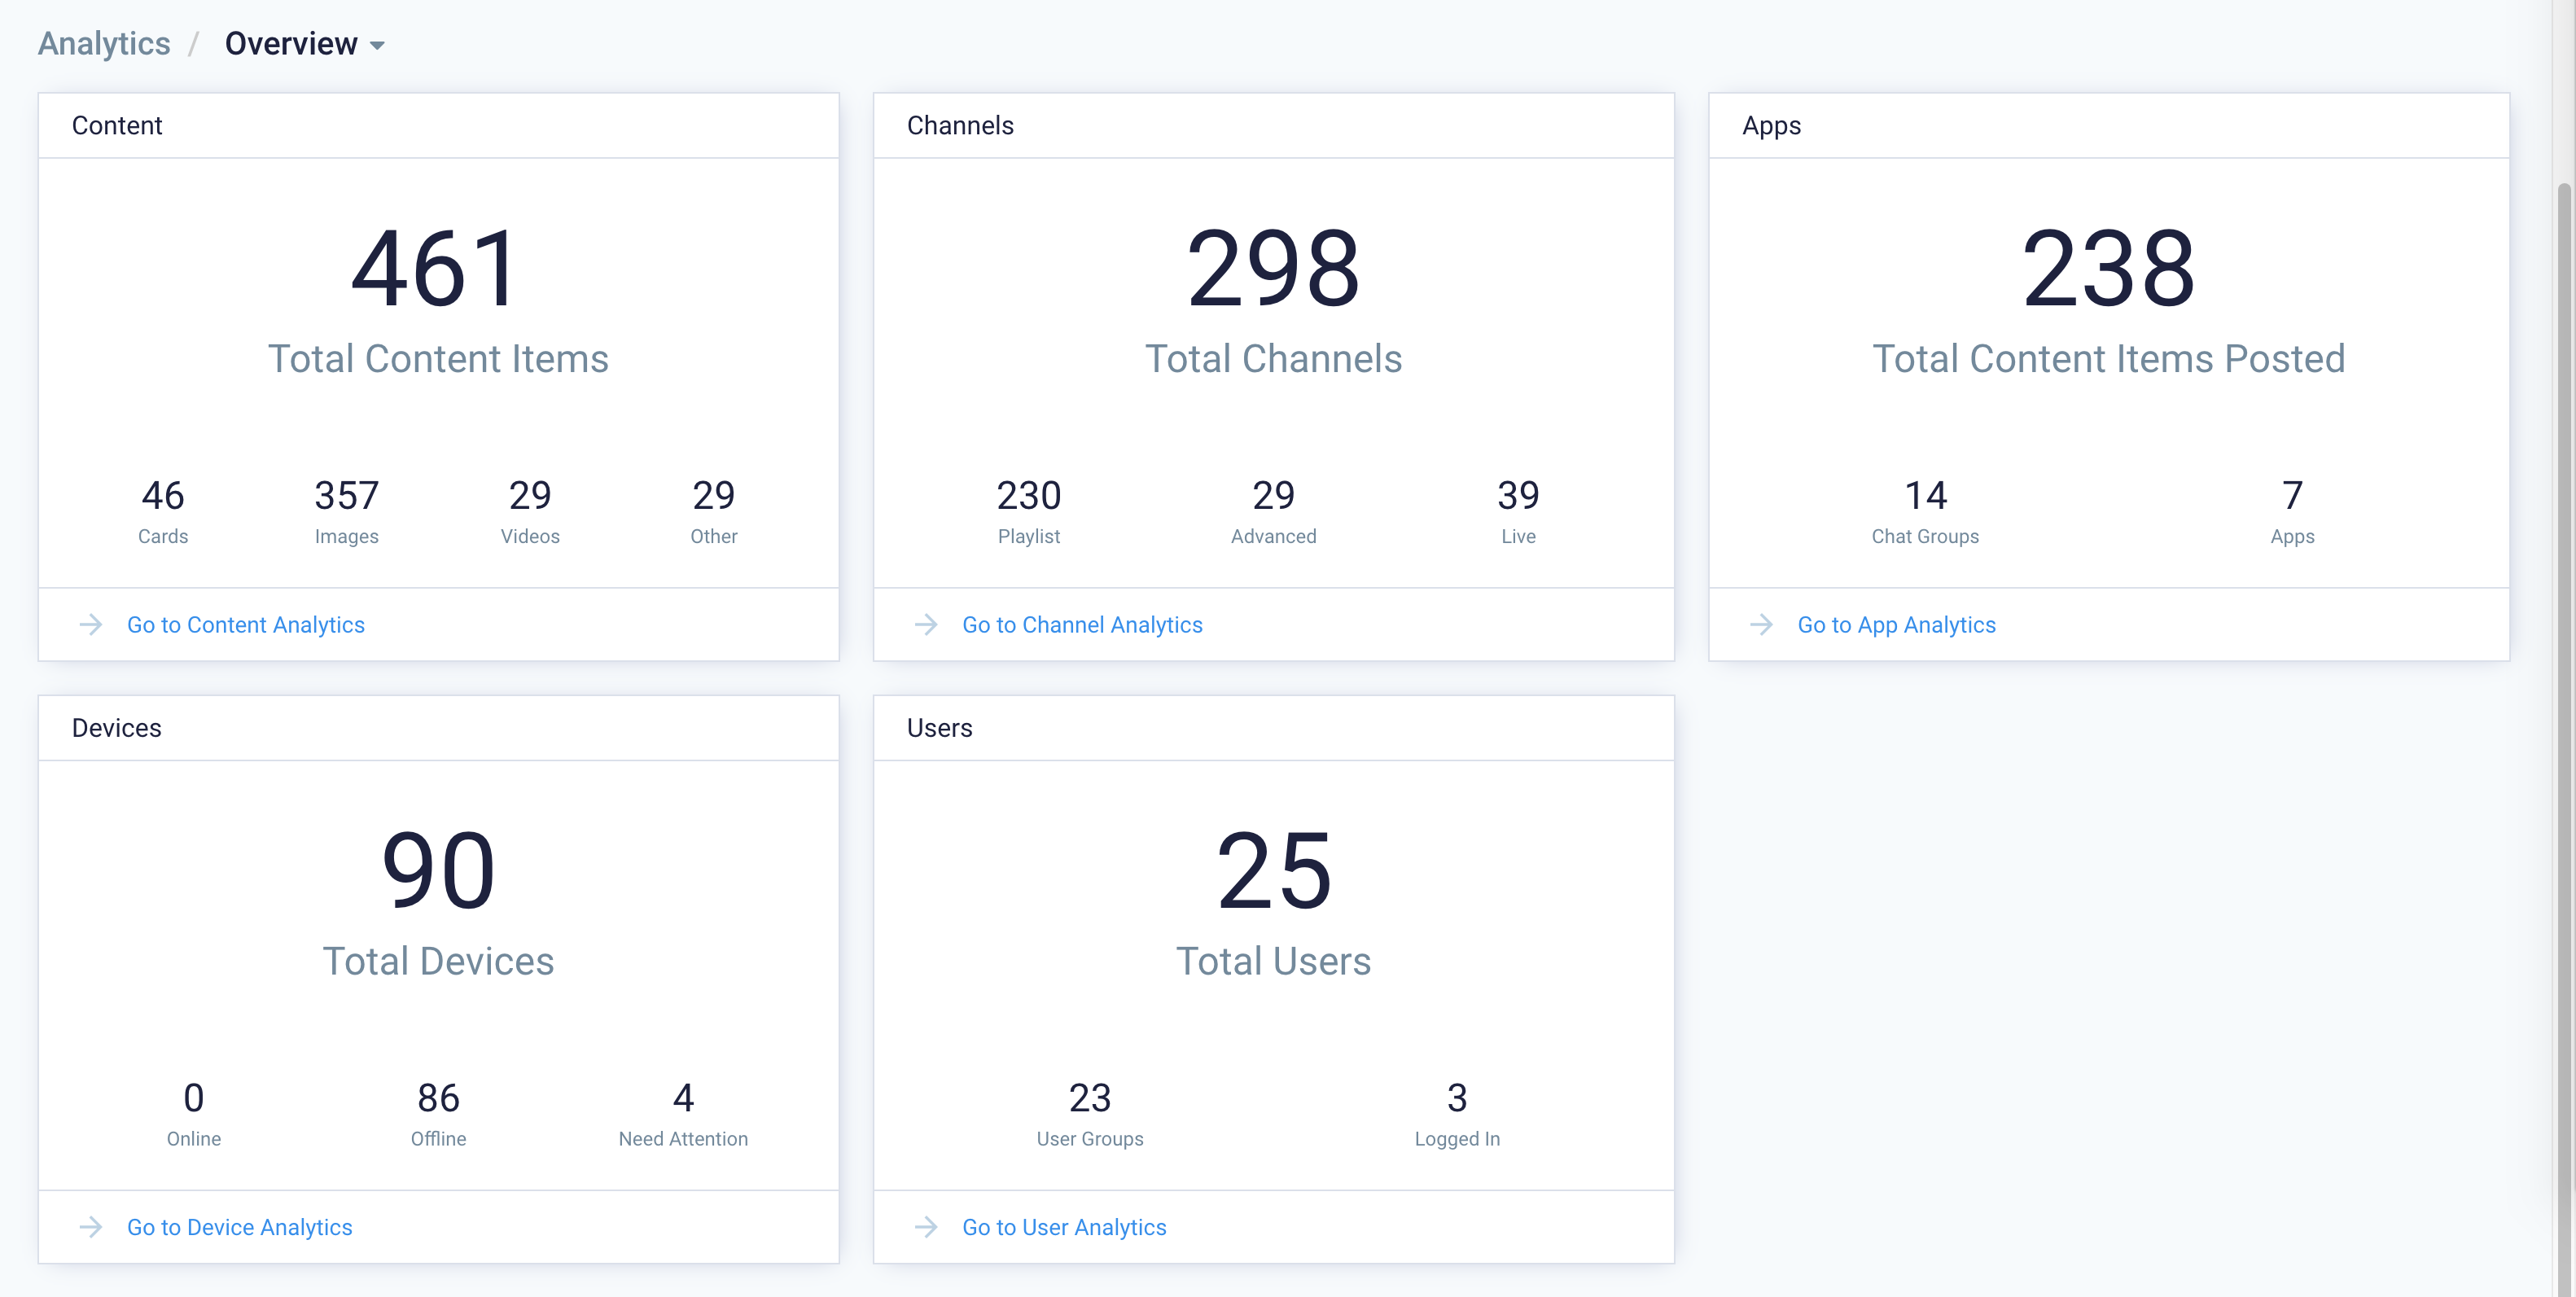
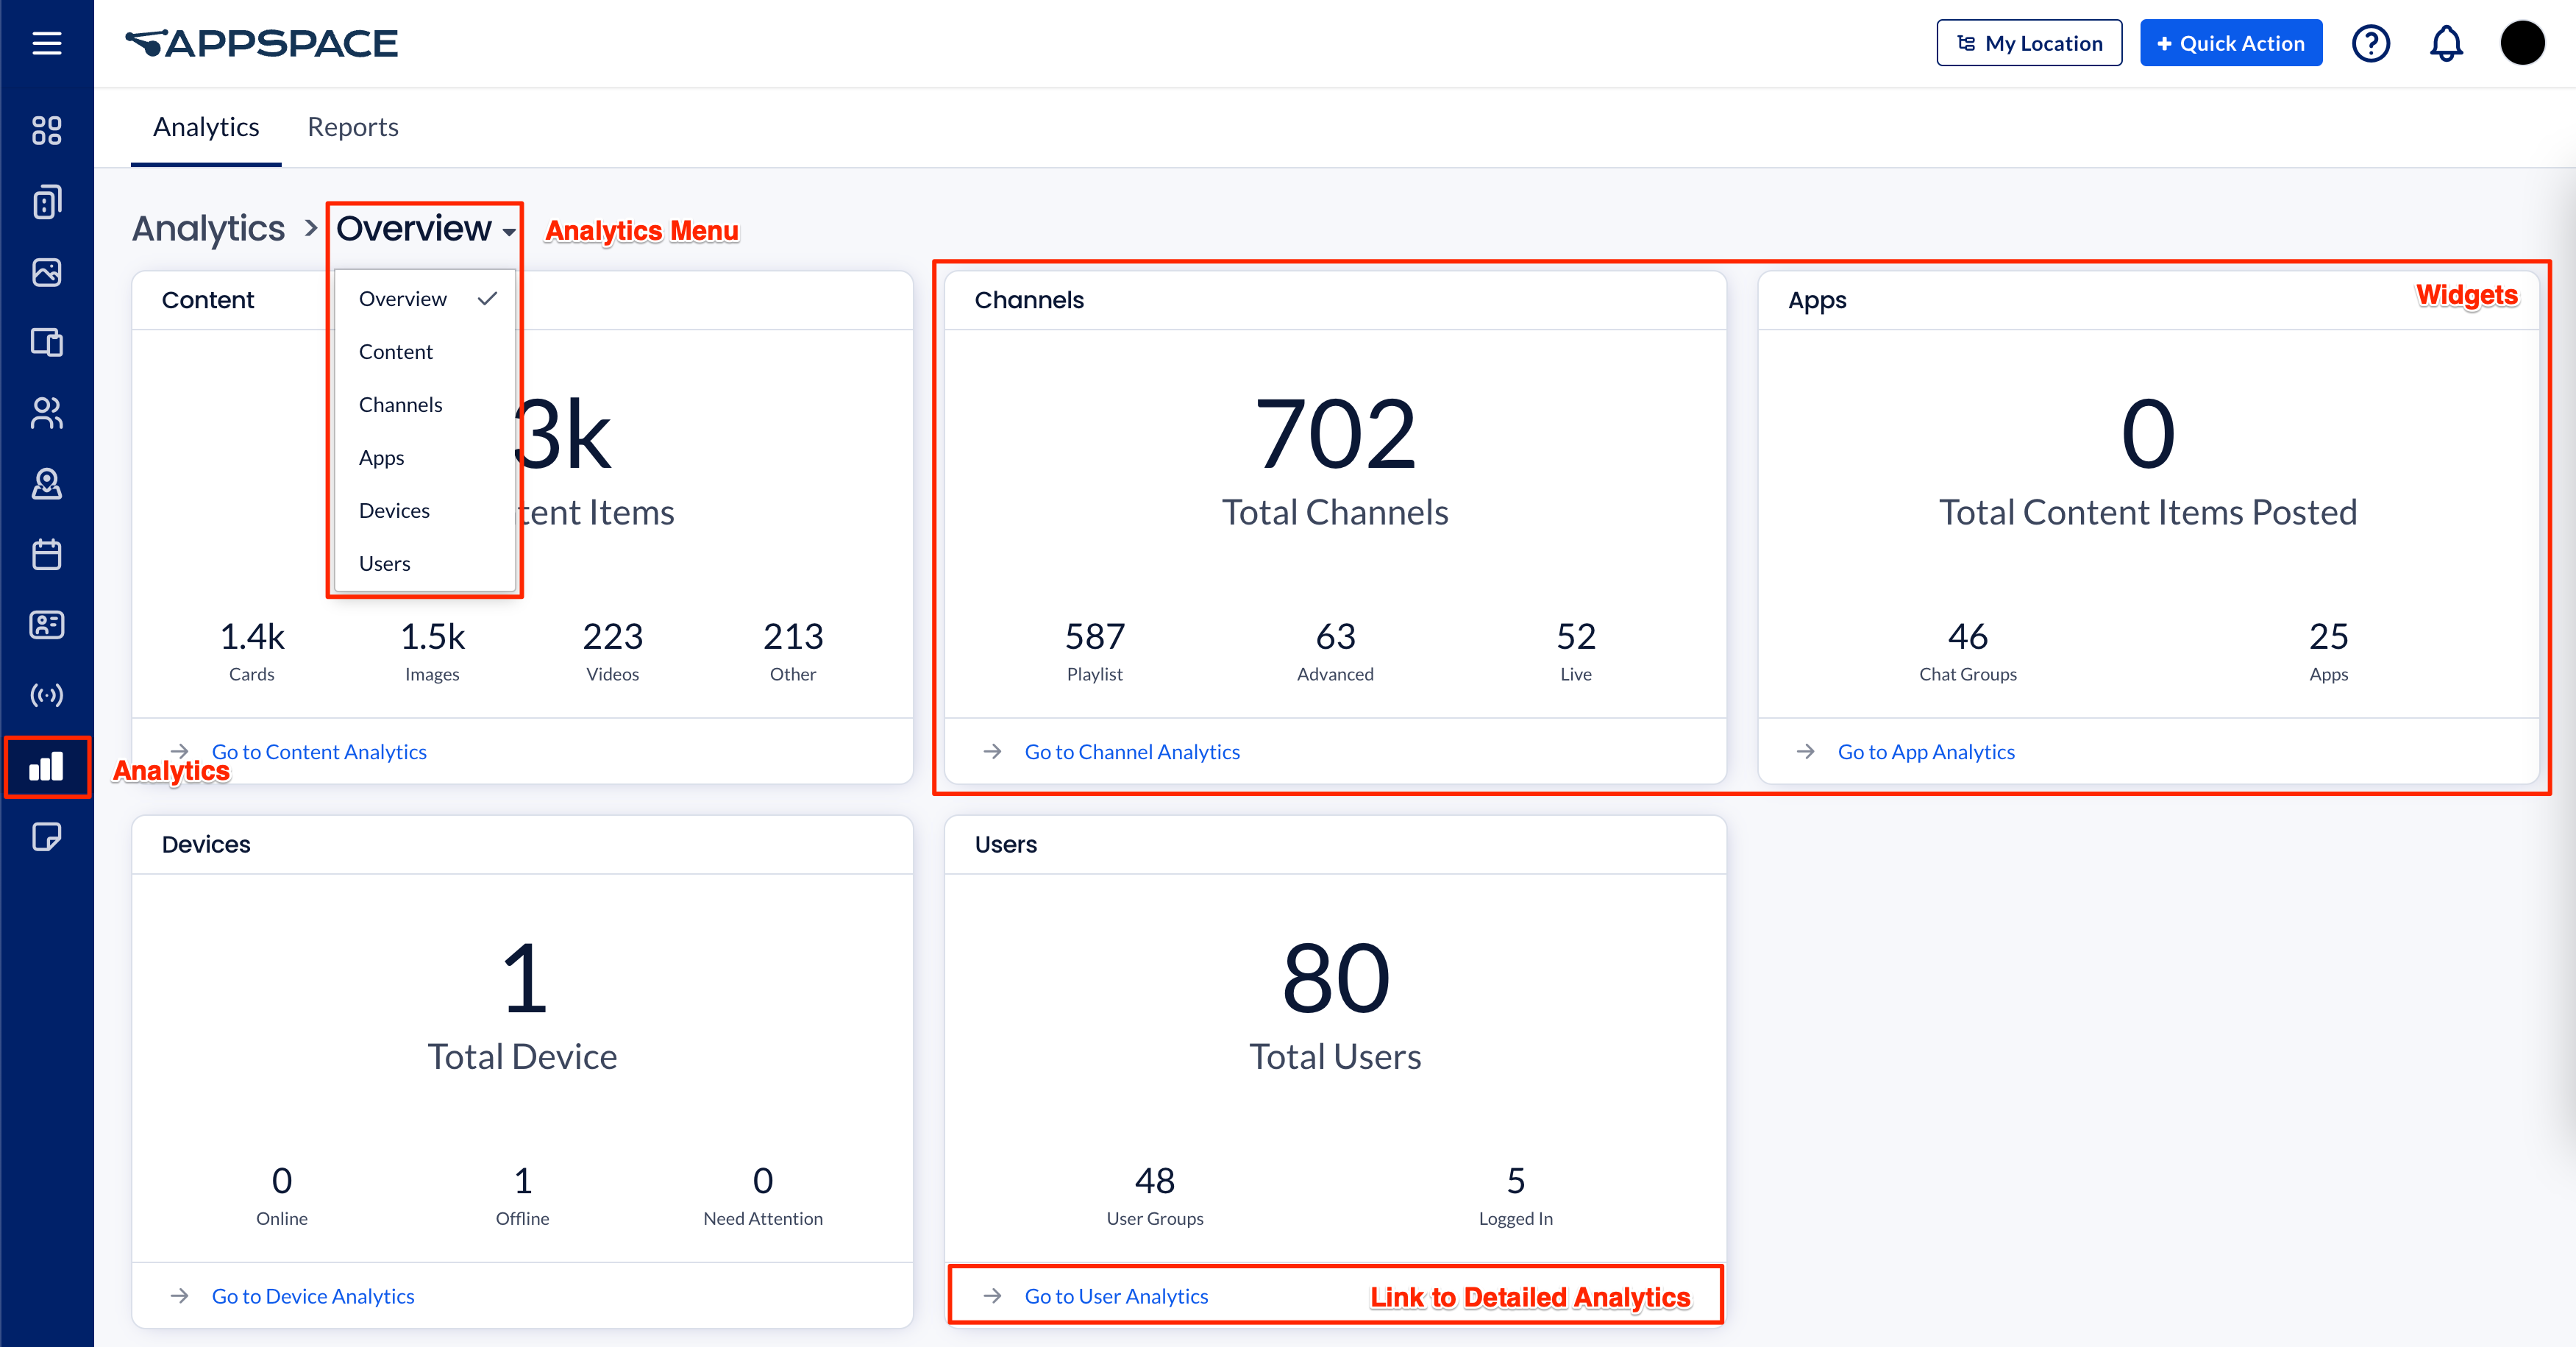
Click Analytics from the ☰ Appspace menu to access the Analytics module. The main Analytics Overview dashboard has several widgets displaying an overall summary of all the content, channels, enterprise messaging apps, users, devices, and the Employee App portal, usage statistics.
The following are the main widgets displayed on this dashboard, which display a summary of usage statistics for the entire Appspace account:
- Channels: Displays the current snapshot of how many channels are in the account and a breakdown by type.
- Content: Displays the current snapshot of how many individual content items are in the account and a breakdown by type.
- Apps: Displays the current snapshot of posts that have been made to enterprise messaging apps. It also displays the total number of Apps connected (passports) and the number of connected chats (channels in enterprise messaging apps)
- Devices: Displays the current snapshot of how many devices are registered to the account and a breakdown by their health status.
- Users: Displays the current snapshot of how many users are registered to the account and the number of user groups.
You may click on the link below each widget or select an option from the Analytics drop-down menu to view statistics for the following:
Content
The Content analytics page displays the following analytical widgets:
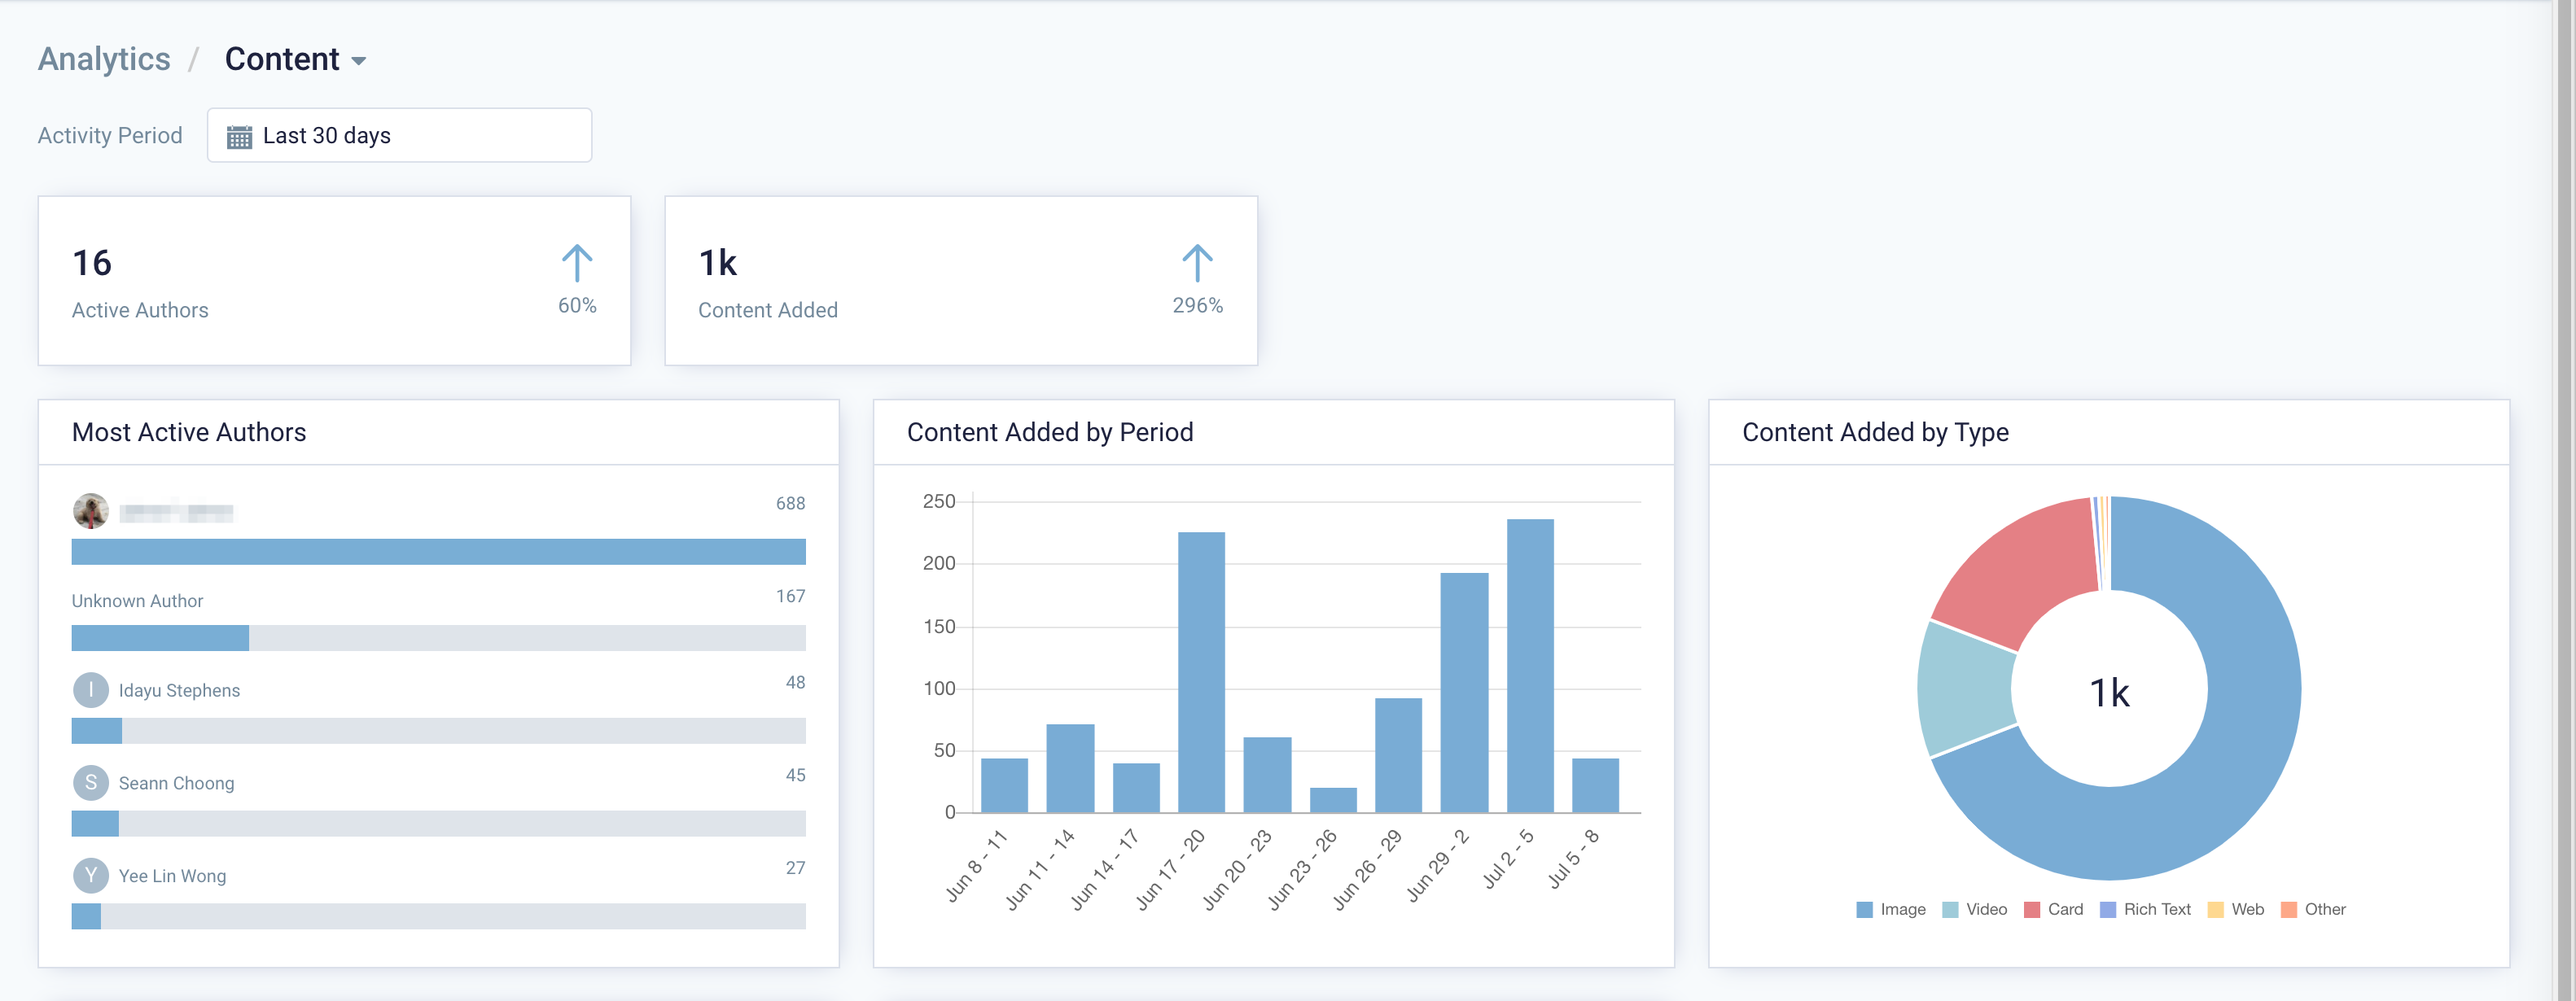
Trend widgets:
- Active Authors: Tracks the number of unique users that have authored content in the channel over the specified time period. It displays the total number with an up/down trend percentage.
- Content Added: Tracks the number of content items created or uploaded over the specified time period. It displays the total number with an up/down trend percentage.
Widgets:
- Most Active Authors: Tracks the number of channel updates made over the specified time period. It displays the total number with an up/down trend percentage.
- Content Added by Period: Tracks the number of content items created over the specified time period. It displays the number of items created broken down into smaller time slices to show a trend.
- Content Added by Type: Tracks the number of content items created over the specified time period. It displays the total number with a breakdown by type. It will show individual totals on mouse-over.
- Cards Created by Template: Tracks the cards created over the specified time period. The data is broken down by template. It displays the top 5 templates used as well as the total number of cards created, based on those templates.
- Cards Created by Template Type: Tracks the cards created over the specified time period. The data is broken down by template type. It displays the top 5 templates type used as well as the total number of cards created, based on those template types.
Channels
The Channels analytics page displays the following analytical widgets:
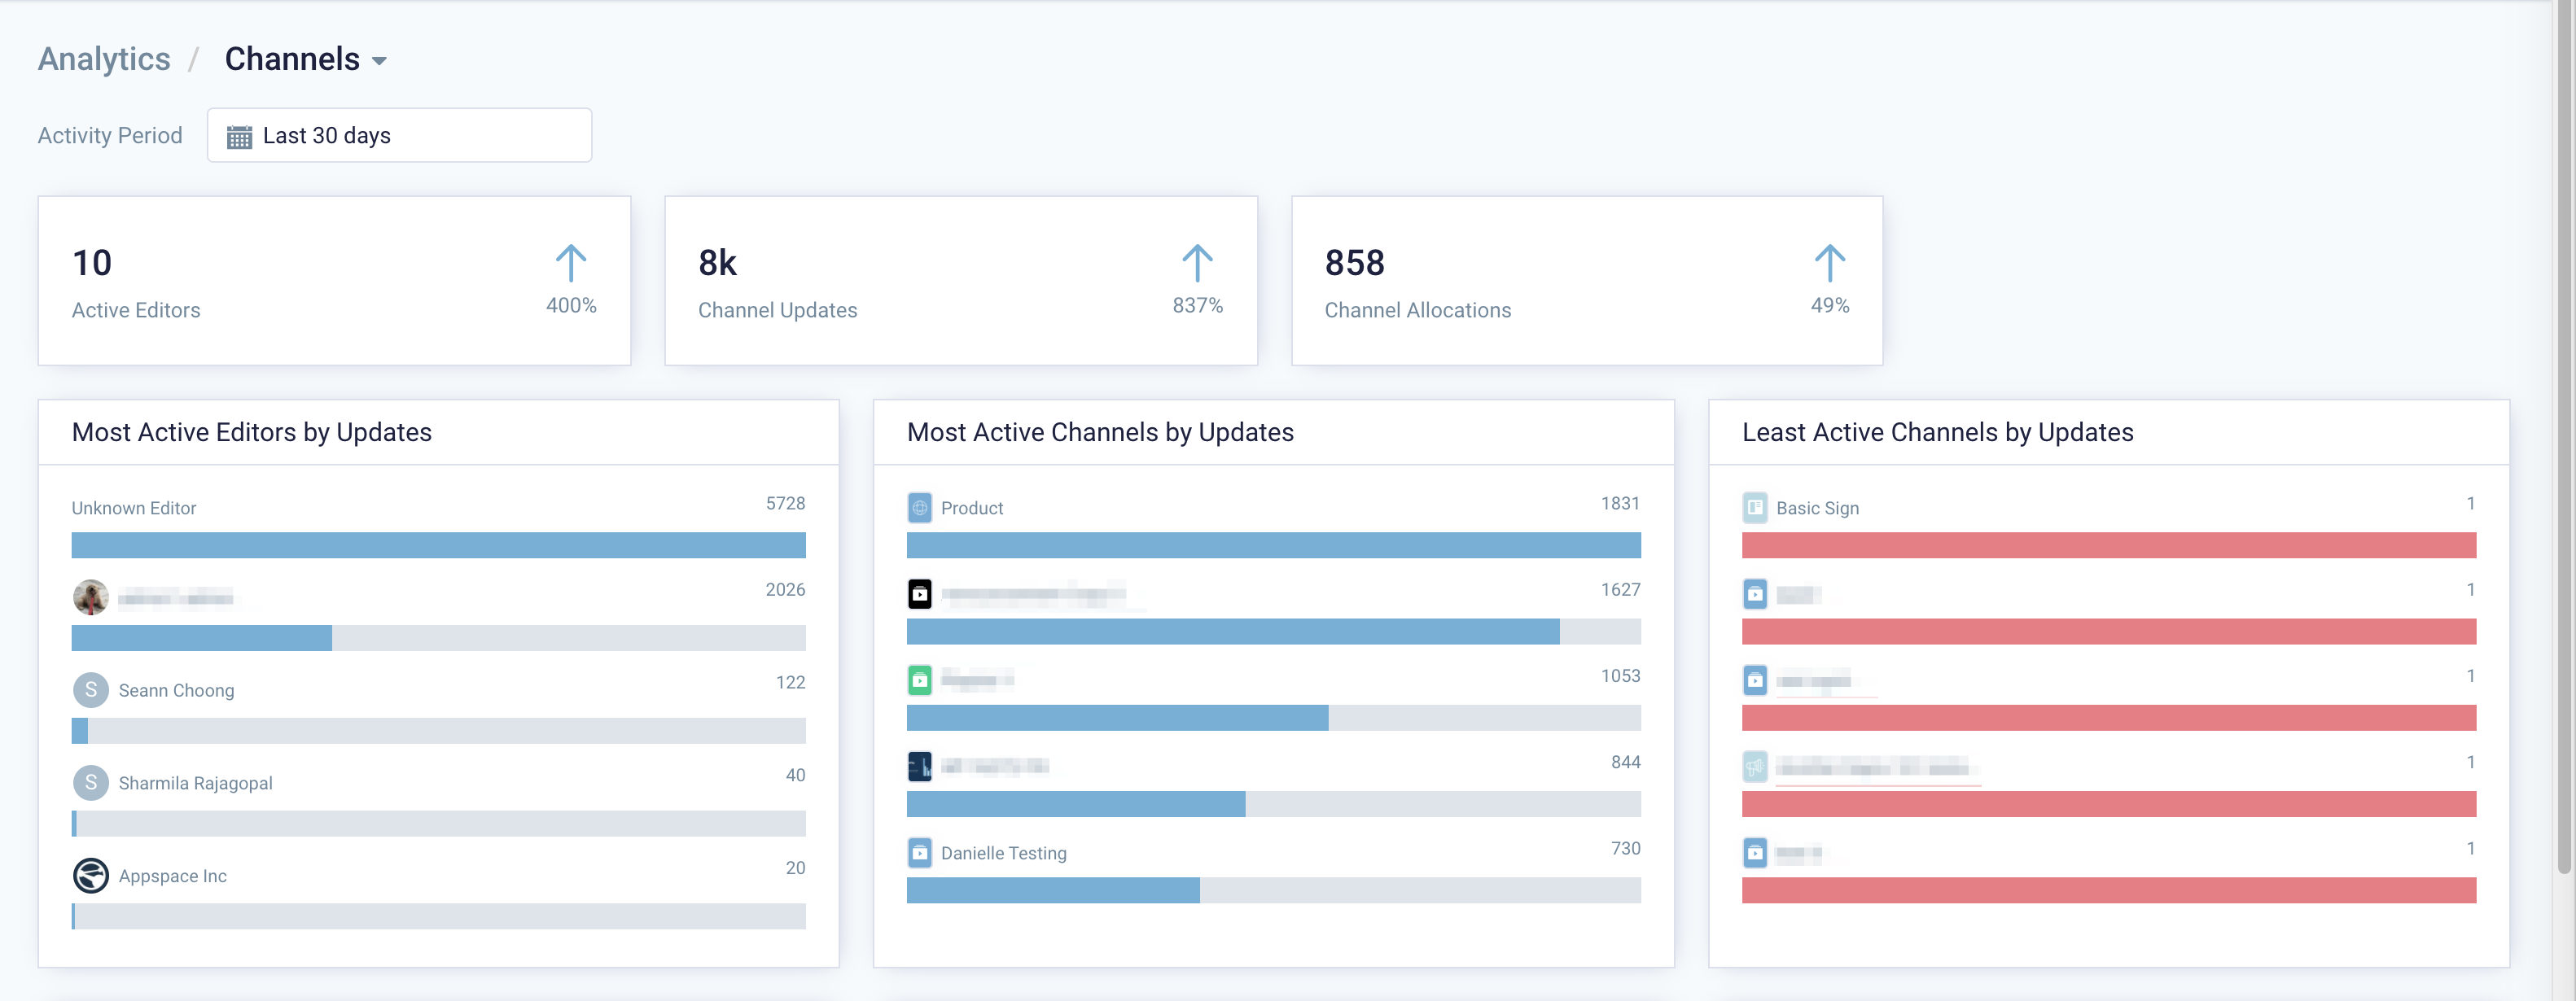
Trend widgets:
- Active Editor: Tracks the current number of unique users that have edited a channel. It shows the total number and an up/down trend percentage over the set time period.
- Channel Updates: Tracks the number of channel updates made over the specified time period. It displays the total number with an up/down trend percentage.
- Content Allocation: Tracks the number of content allocations made over the specified time period It displays the total number with an up/down trend percentage.
Widgets:
- Most Active Editors by Updates: Tracks the number of updates an editor makes to a channel. It displays the top 5 most active editors and their total number of updates made over the specified time period.
- Most Active Channels: Tracks the number of channel updates made over the specified time period. It displays the top 5 most updated channels and the total updates made to each.
- Latest Active Channels: Tracks the number of channel updates made over the specified time period. It displays the top 5 least updated channels and the total updates made to each.
- Content Allocations by Period: Tracks the number of content allocations made over the specified time period. It displays the number of updates made broken down into smaller time slices to show a trend.
- Content Allocations by Type: Tracks the number of content items allocated to channels over the specified time period. It displays the total number with a breakdown by type. It will show individual totals on mouse-over.
- Content Allocated by Template: Tracks the cards allocated to channels over the specified time period. The data is broken down by template. It displays the top 5 templates used as well as the total number of cards allocated, based on those templates.
- Content Allocated by Template Type: Tracks the cards allocated to channels over the specified time period. The data is broken down by template type. It displays the top 5 templates type used as well as the total number of cards allocated, based on those template types.
- Content Approvals: Tracks the number of channel approvals over the specified time period. It displays the total number and a breakdown of approval status as well as the average response time.
Apps
The Apps analytics page gathers data from the newly launched Employee App portal and enterprise messaging apps, and displays the following analytical widgets:
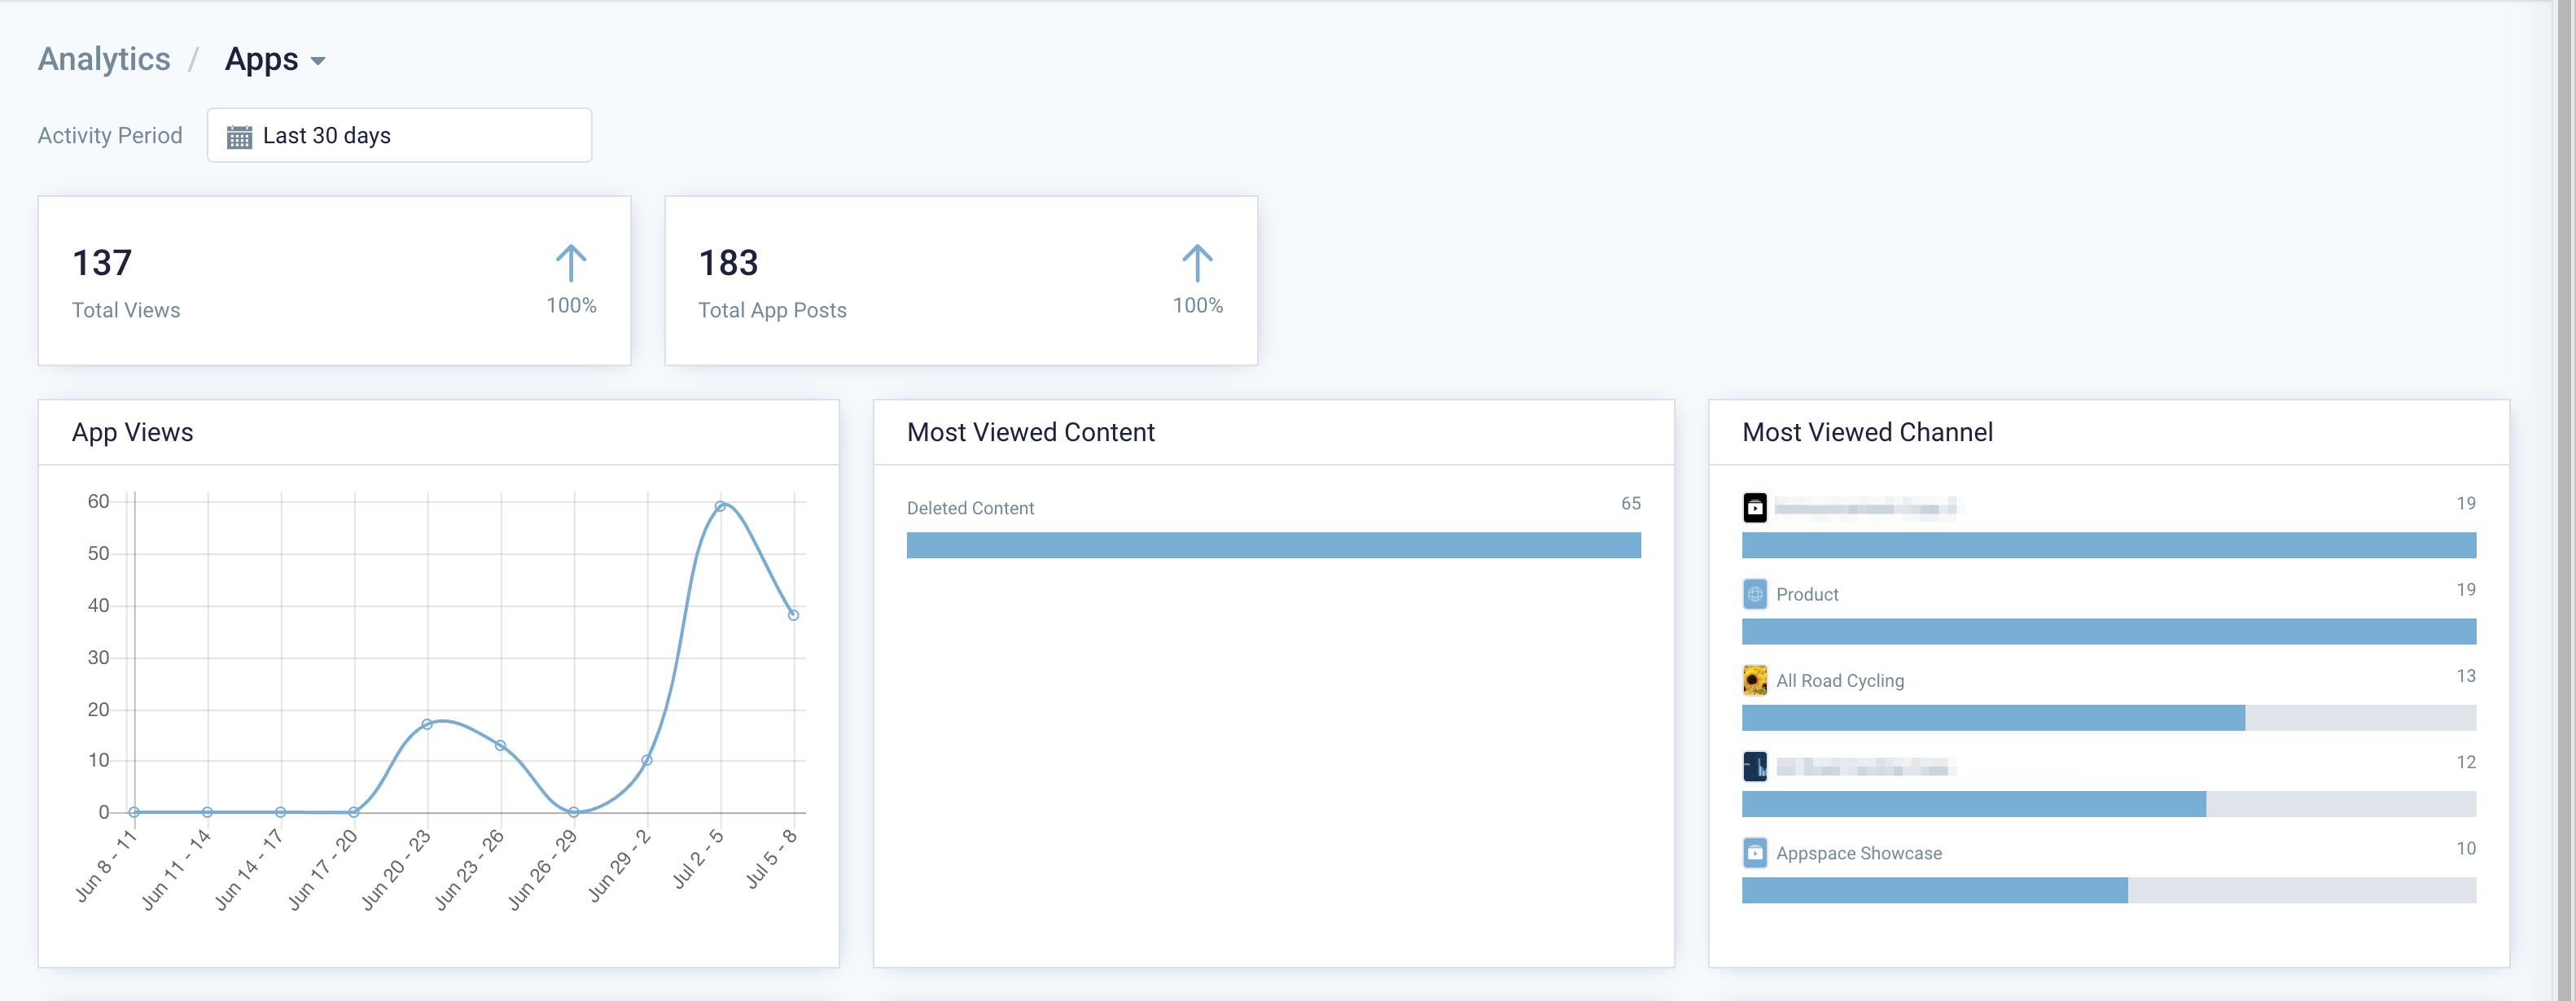
Trend widgets:
- Total Views: Tracks the number of unique content views in the Employee App portal. It displays the total number with an up/down trend percentage.
- Total Posts: Tracks the number of posts made to enterprise messaging apps. It displays the total number with an up/down trend percentage.
Widgets:
- Content Views by Period: Tracks the number of content views in the Employee App portal over the specified time period.
- Most Viewed Content: Tracks the number of views in the Employee App portal over the specified time period. It displays the top 5 most viewed items and their view count.
- Most Viewed Channel: Tracks the number of views in the Employee App portal over the specified time period. It displays the top 5 most viewed channels and their view count.
- App Posts: Tracks the number of posts made to enterprise messaging Apps over the specified time period. It displays the number of posts broken down into smaller time slices to show a trend.
- App Posts by Content Type: Tracks the number of posts made to enterprise messaging Apps over the specified time period. The data is broken down by content type.
- App Posts by Chat: Tracks the number of posts made to enterprise messaging Apps over the specified time period. The data is broken down by individual chats (target channels in messaging Apps). It displays the top 5 chats, as well as their total number of posts.
Devices
The Devices analytics page displays the following analytical widgets:
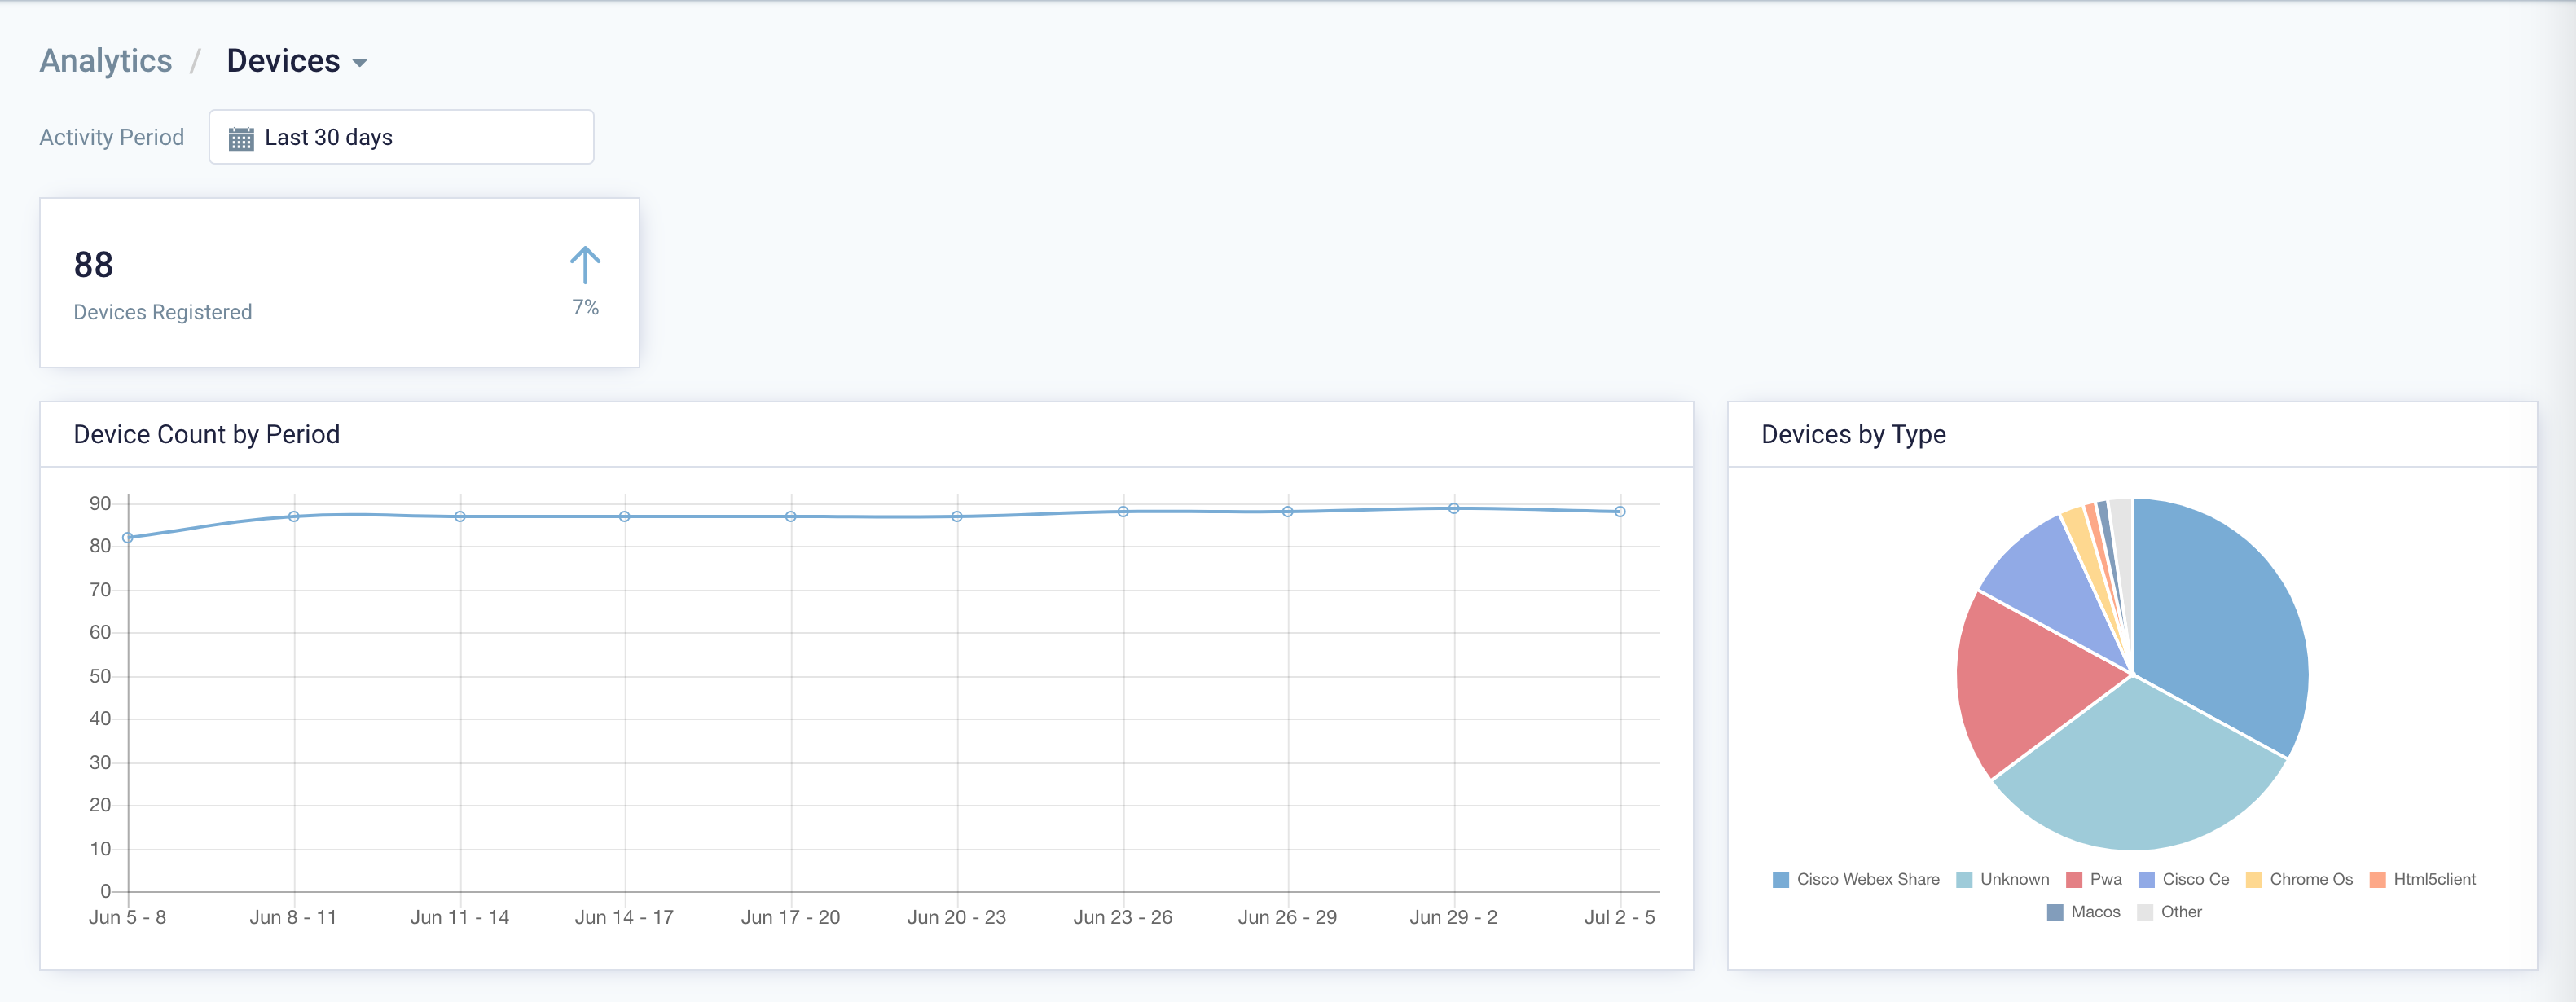
Trend widgets:
- Devices Registered: Tracks the number of devices registered over the specified time period. It displays the total number with an up/down trend percentage.
Widgets:
- Device Count by Period: Tracks the number of devices registered over the specified time period. It displays the number of devices broken down into smaller time slices to show a trend.
- Devices by Type: Tracks the number of devices over the specified time period. It displays the total number with a breakdown by type. It will show individual totals on mouse-over.
Users
The Users analytics page displays the following analytical widgets:
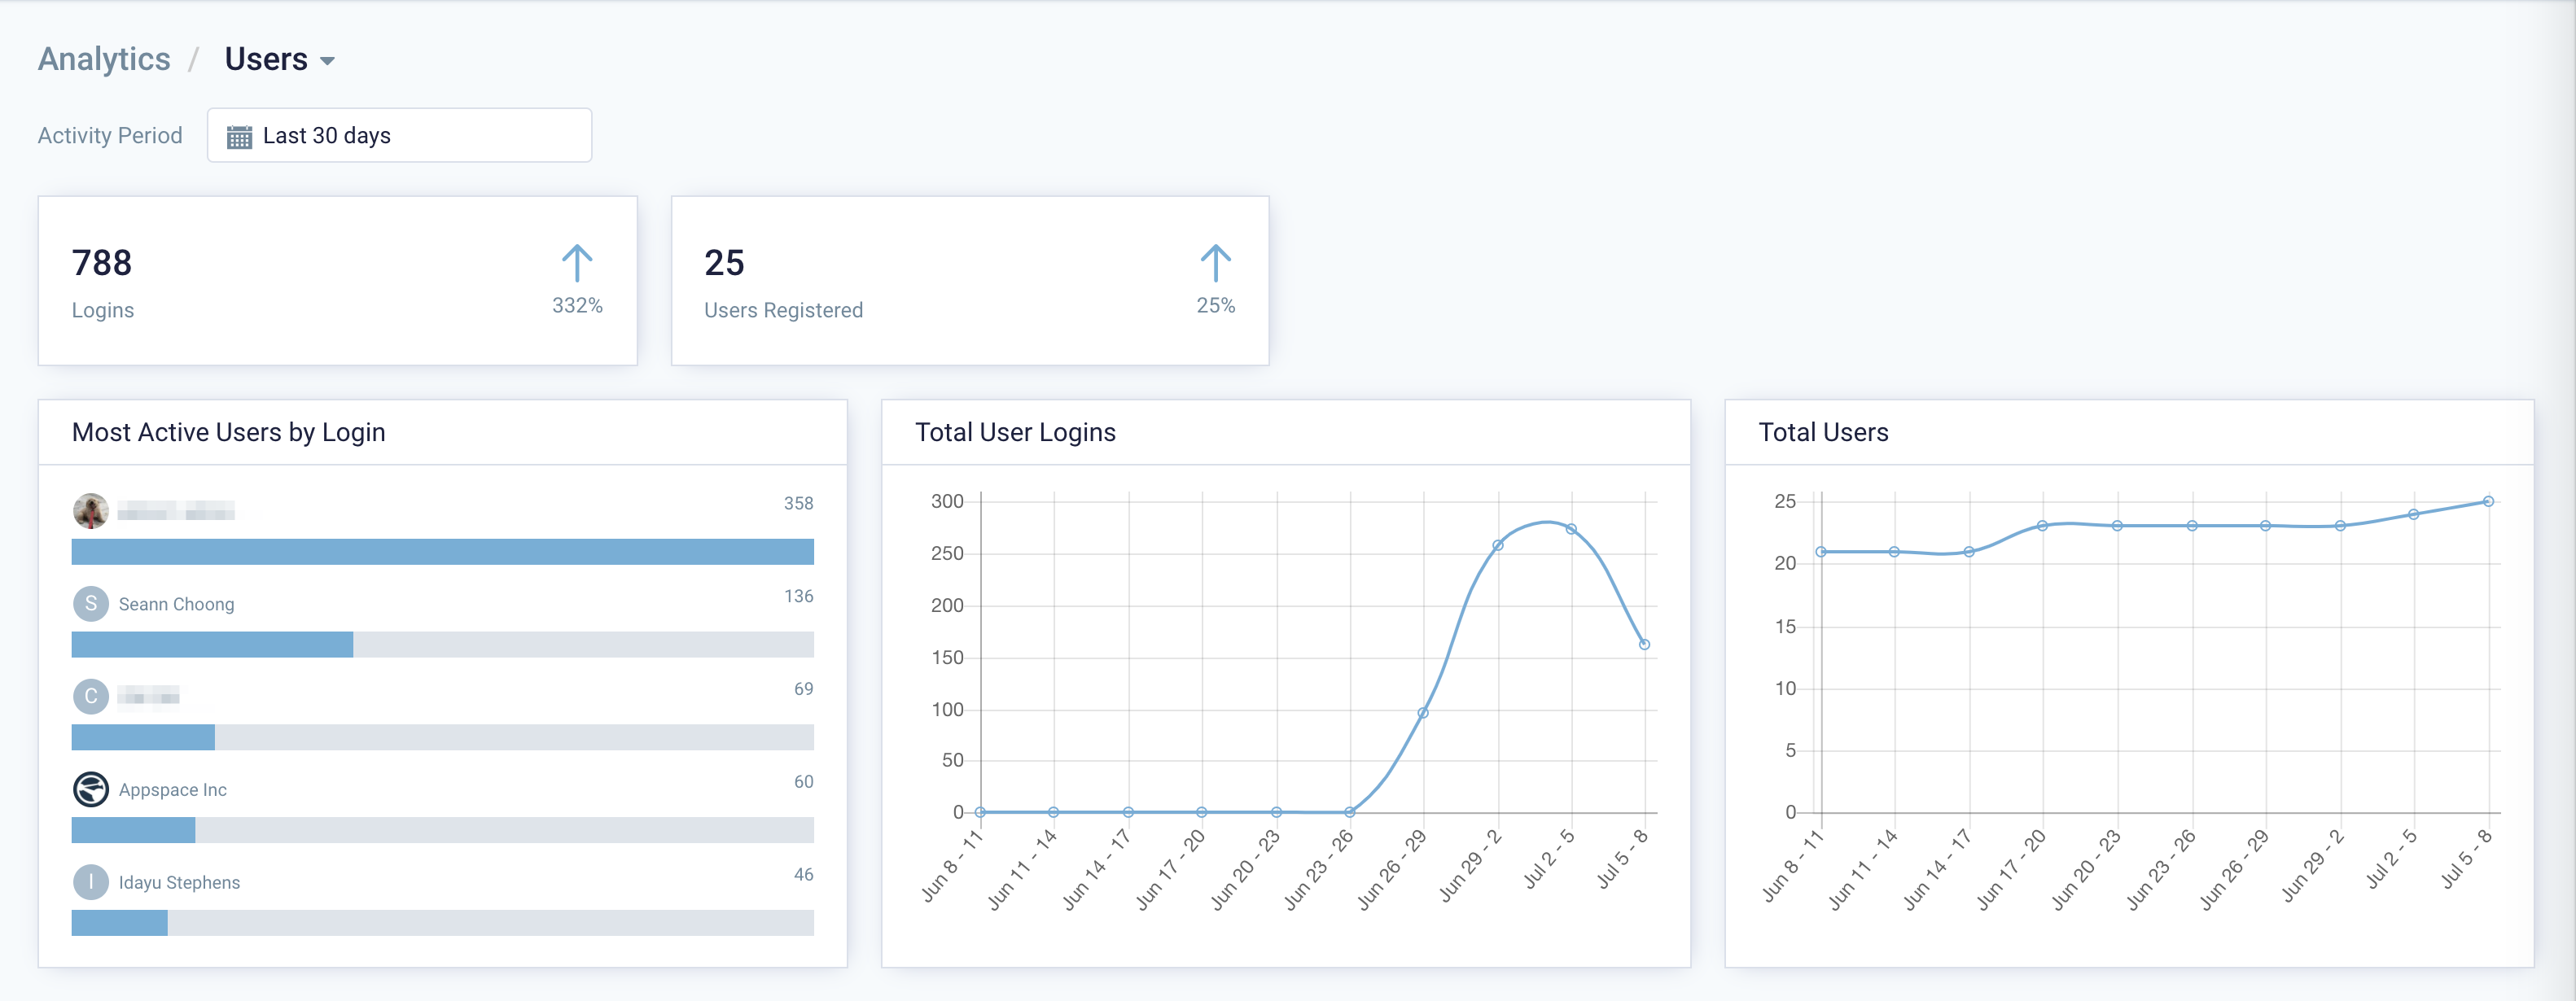
Trend widgets:
- Logins: Tracks the number of user logins over the specified time period. It displays the total number with an up/down trend percentage.
- Users Registered: Tracks the number of user accounts over the specified time period. It displays the total number with an up/down trend percentage.
Widgets:
- Most Active Users by Login: Tracks the number of user logins over the specified time period. It displays the top 5 most active users and their login count.
- Total Users Logins: Tracks the number of user logins over the specified time period. It displays the number of logins broken down into smaller time slices to show a trend.
- Total Users: Tracks the number of users over the specified time period. It displays the number of users broken down into smaller time slices to show a trend.
View Analytics In Other Modules
View Playlist Channel Analytics
You may now also view detailed analytics for each playlist channel.
- Click Channels from the ☰ Appspace menu.
- Select any desired playlist channel, and click the Analytics tab.
- You may click the Activity Period drop-down, to select a different time period to get a better insight into the usage of the channel within that time frame.
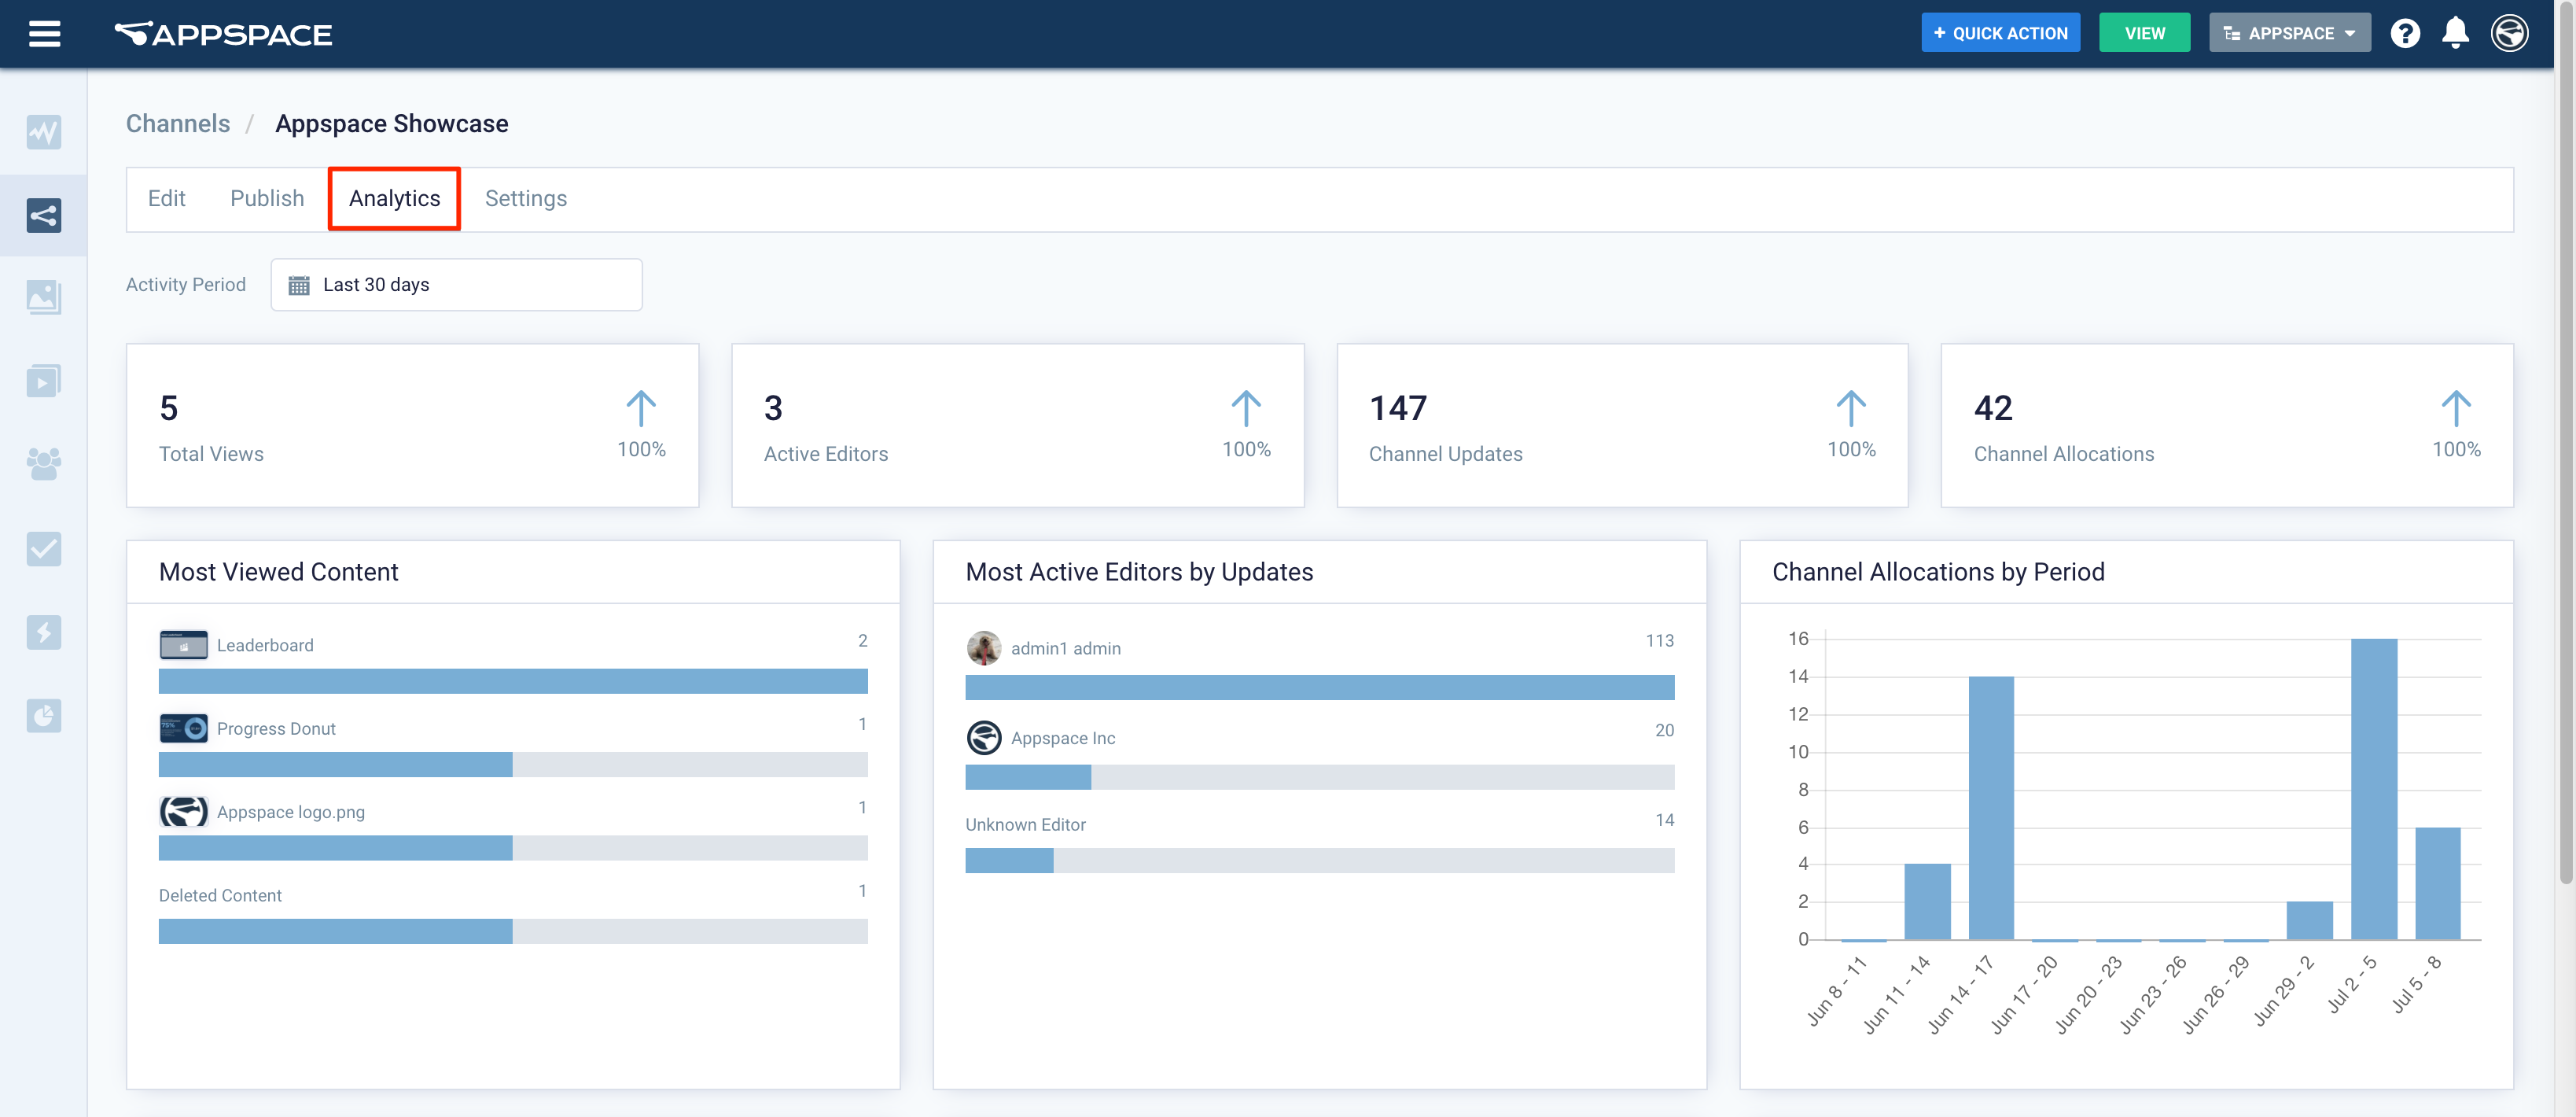
Trend widgets:
- Total Views: Tracks the number of unique content views in the Employee App portal. It displays the total number with an up/down trend percentage.
- Active Editor: Tracks the current number of unique users that have edited a channel. It shows the total number and an up/down trend percentage over the set time period.
- Channel Updates: Tracks the number of channel updates made over the specified time period. It displays the total number with an up/down trend percentage.
- Content Allocation: Tracks the number of content allocations made over the specified time period It displays the total number with an up/down trend percentage.
Widgets:
- Most Viewed Content: Tracks the number of views in the Employee App portal over the specified time period. It displays the top 5 most viewed items and their view count.
- Most Active Editors by Updates: Tracks the number of updates an editor makes to a channel. It displays the top 5 most active editors and their total number of updates made over the specified time period.
- Channel Allocations by Period – Tracks the number of channel allocations made over the specified time period. It displays the number of updates made broken down into smaller time slices to show a trend.
- Channel Allocations by Content Type – Tracks the number of content items allocated to channels over the specified time period. It displays the total number with a breakdown by type. It will show individual totals on mouse-over.
- Content Allocated by Template: Tracks the cards allocated to channels over the specified time period. The data is broken down by template. It displays the top 5 templates used as well as the total number of cards allocated, based on those templates.
- Cards Allocated by Template Type: Tracks the cards allocated to channels over the specified time period. The data is broken down by template type. It displays the top 5 templates type used as well as the total number of cards allocated, based on those template types.
- Number of Content Posted to Apps: Tracks the number of posts made to Connect Apps over the specified time period It displays the number of posts broken down into smaller time slices to show a trend.
View Individual Content Analytics In Library
You may now also view detailed analytics for each content added to the Library or playlist channel.
- Click Library from the ☰ Appspace menu.
- Select and click the desired content, and select the Analytics tab.
- You may click the Activity Period drop-down, to select a different time period to get a better insight into the usage of the content within that time frame.
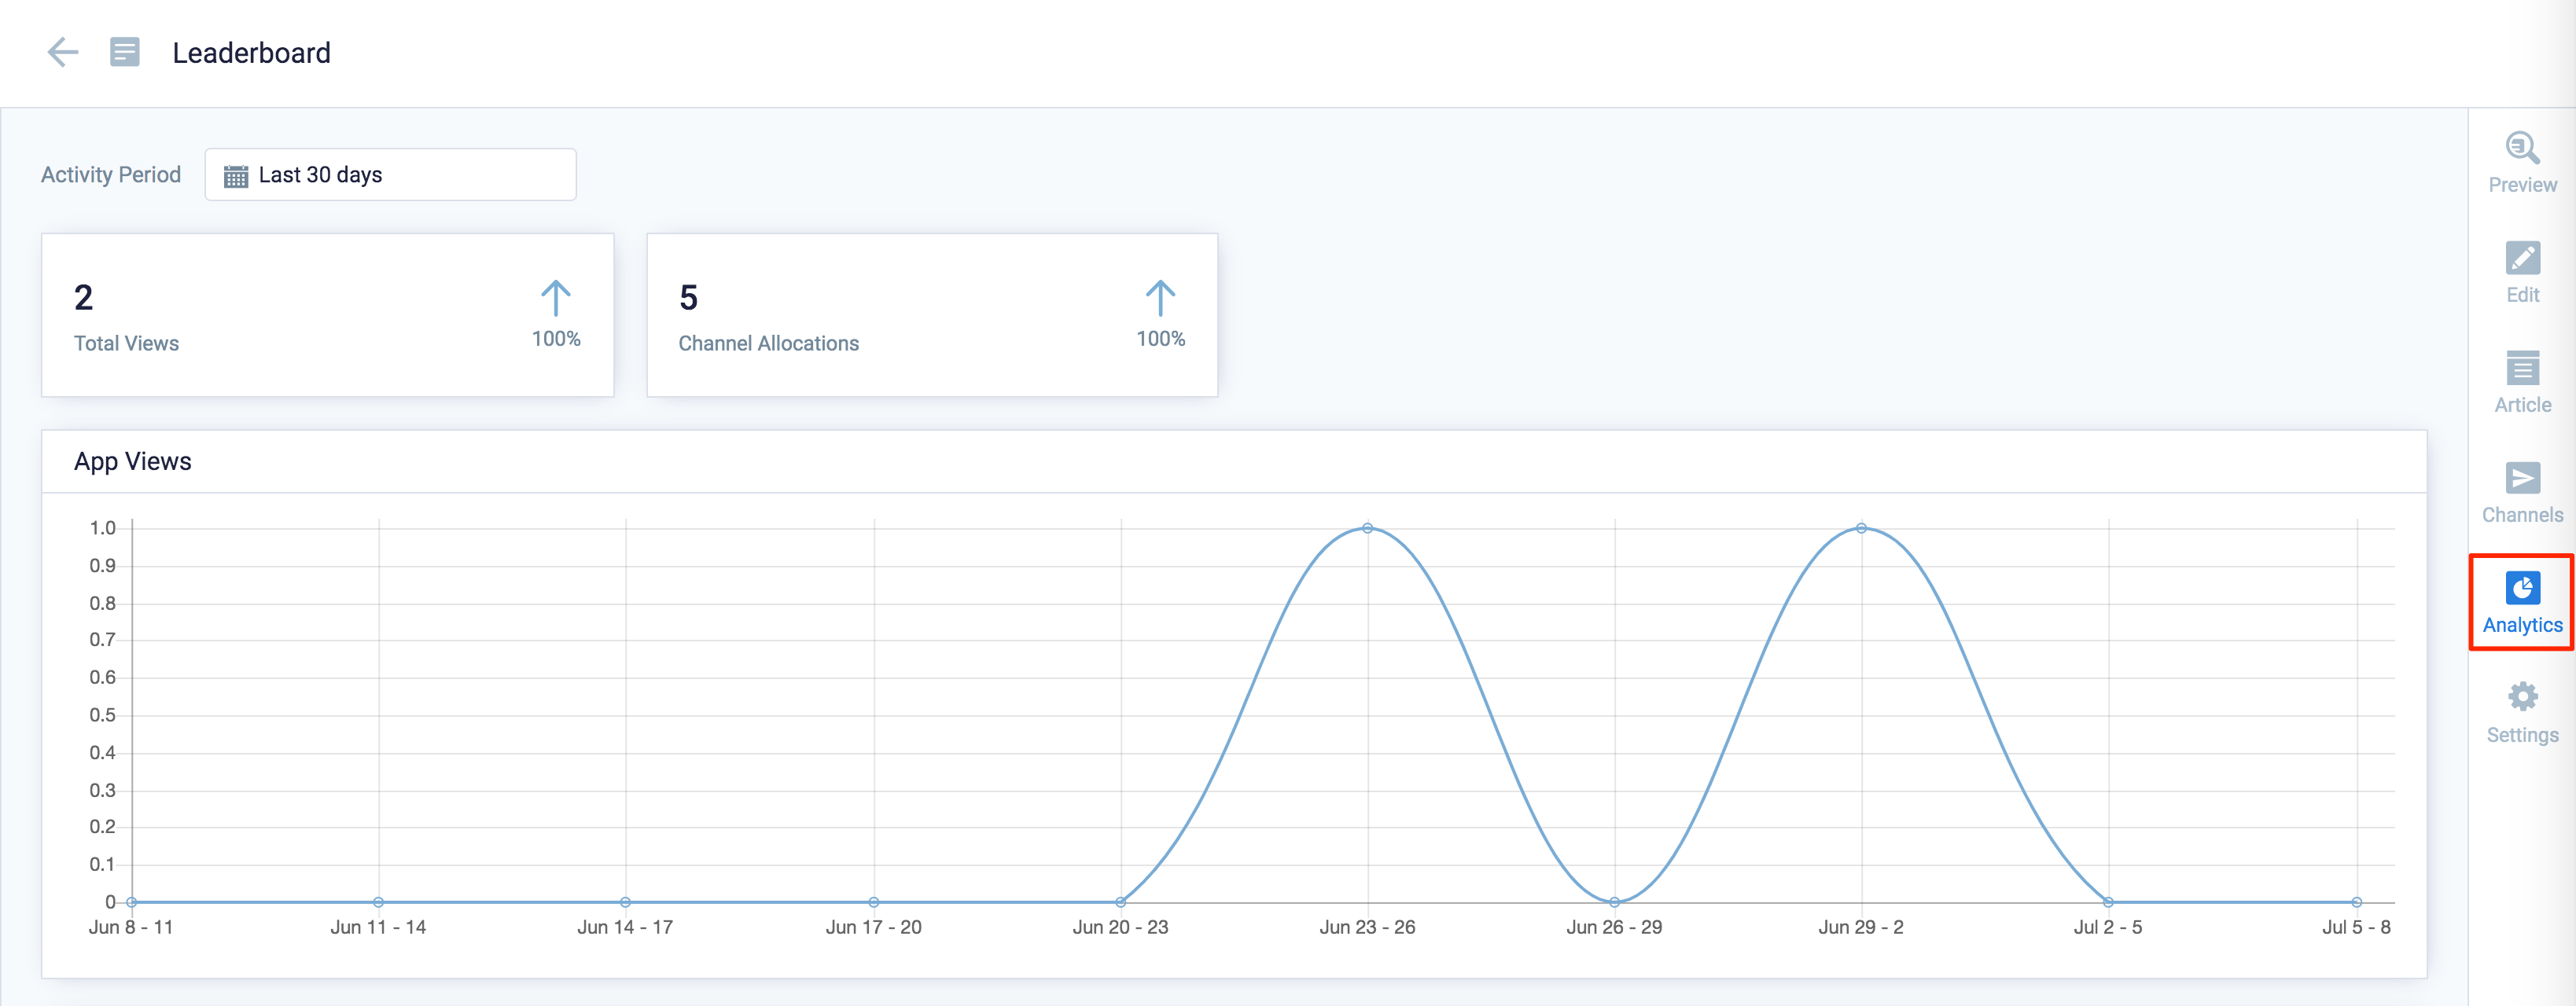
Trend widgets:
- Total Views: Tracks the number of unique content views in the Employee App portal. It displays the total number with an up/down trend percentage.
- Channel Allocations: Tracks the number of channels the piece of content has been allocated to. It displays the total number with an up/down trend percentage.
Widgets:
- App Views: Tracks the number of content views in the Connect Portal over the specified time period.
- Channel Allocations by Period – Tracks the number of channel allocations made over the specified time period. It displays the number of updates made broken down into smaller time slices to show a trend.
View Space Reservation Analytics
You may now also view detailed analytics for Space Reservations, by accessing the Analytics tab in Reservations.
For more detailed information, visit the Browse and Navigate Space Reservations in Appspace 8.x article.
View Visitor Management Analytics
You may now also view detailed analytics for Visitor Management, by accessing the Analytics tab in Visitors.
For more detailed information, visit the Browse and Navigate Visitor Management in Appspace 8.x article.
Reports
Introducing Appspace’s newest reporting feature, the Reports module that allows users to create, view, and export available metrics through the Reports dashboard. This feature aims to provide visibility to the following analytics available specifically for Space Reservations and Visitor Management.
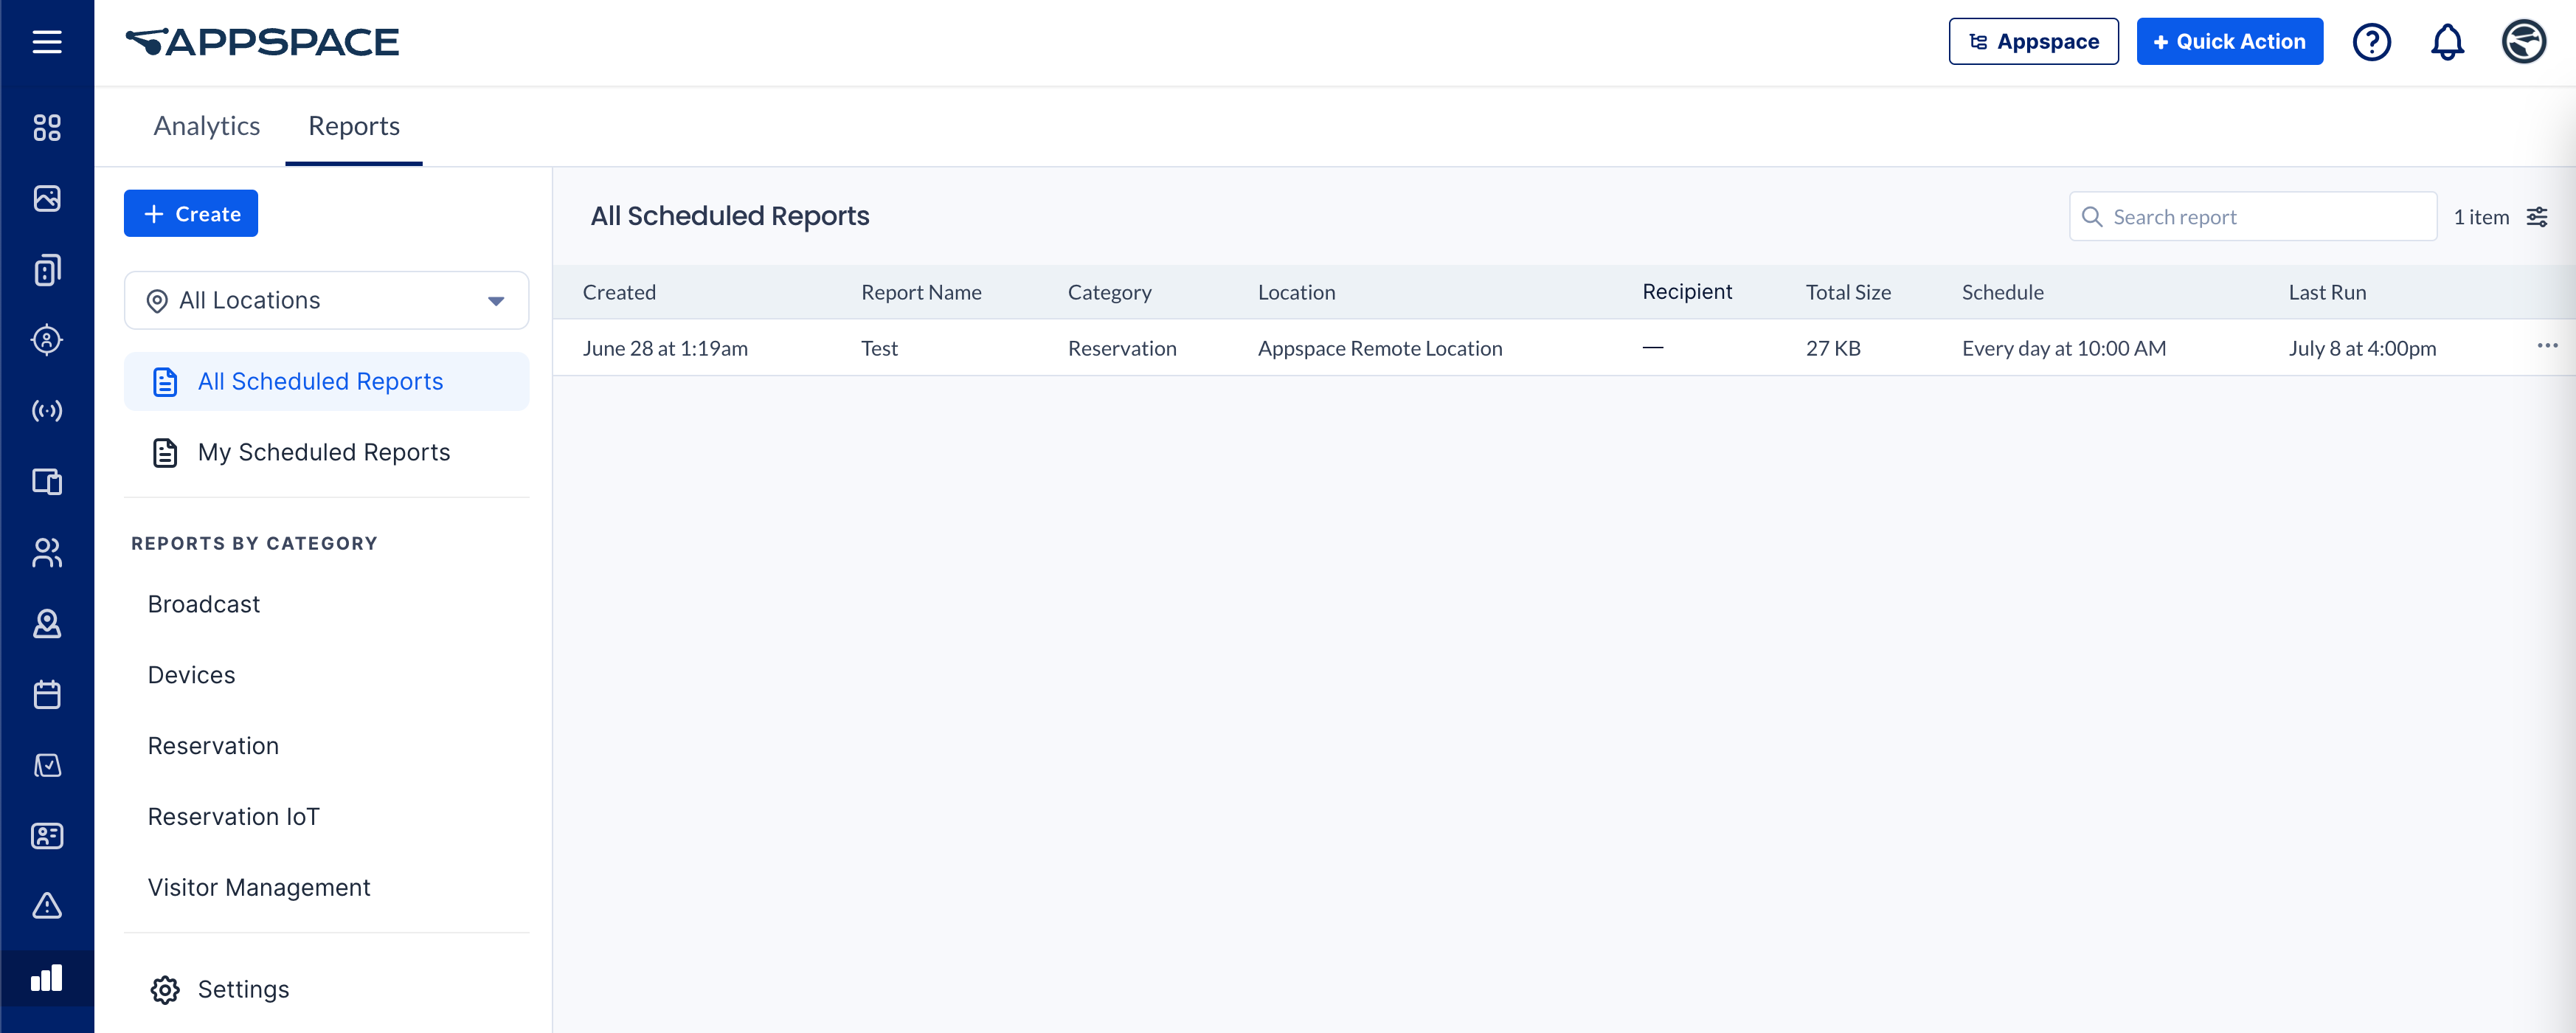
To access the Reports dashboard, click the Analytics from the ☰ Appspace menu, and click the Reports tab.
Here, Account Owners and Location Admins may create, customize, generate, view, and schedule reports based on templates from Space Reservations, Visitor Management, Broadcasts, and a few other modules.
For more detailed information, please visit the Browse and Navigate Reports in Appspace 8.x article.
Was this article helpful?